Vous avez économisé des centaines d'heures de processus manuels lors de la prévision de l'audience d'un jeu à l'aide du moteur de flux de données automatisé de Domo.
Regardez la vidéo

Visualize complex data in an instant.
Turn complex sets of data into meaningful visualizations with just a few clicks in Analyzer.
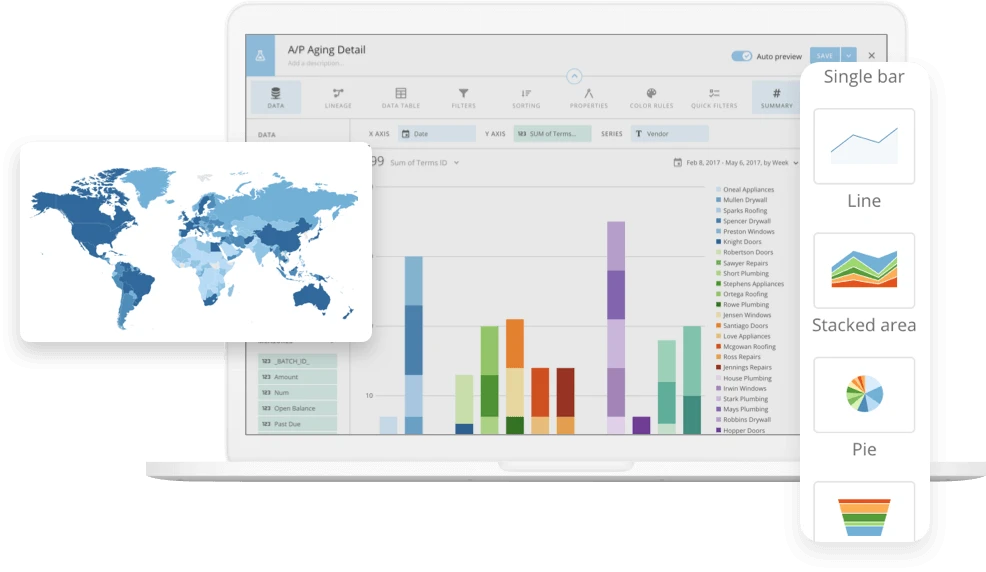
Analyzer makes it easy to refine your visualizations any way you see fit. Choose from our collection of over 150 chart types and more than 7,000 custom maps, including:
Trellis charts with more than one dimension
Data science charts
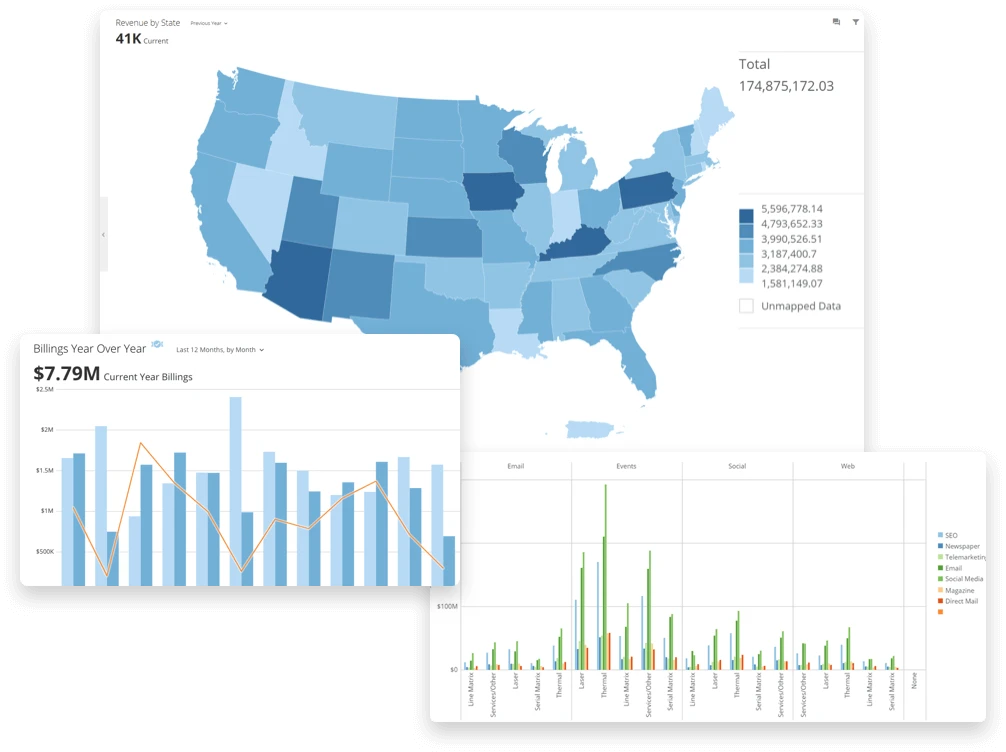
Maps
Period over period charts to compare time periods against one another
Tables
If you need even more flexibility, create custom charts to meet your needs.

In addition to filters you can create on region, timeframe, product, or other columns, Analyzer provides several filtering options to get answers more quickly.

Help users filter and analyze data on the fly with pre-defined filters called Quick Filters.
Add more depth to your data by adding tooltips to show additional values not displayed in the chart itself.
Filter all cards on a page by the same criteria with page-level filters.
Have peace of mind that all data sources are powering your card accurately with a quick view into the DataSet’s Data Lineage.
Filter using criteria such as “contains” and “starts with” with just one click.
Ensure you convey key points with advanced options for presenting your data.

Create calculated fields that reference other columns in your DataSet using Beast Mode.
Create multi-period projections to show predicted changes beyond the current date and time.
Set conditional colors based on your data with Color Rules.
Create annotations on your charts.

For ultimate flexibility in colors, filters, and charts, use Domo Stories to design customized visualizations to guide data analysis—with no need for custom work or coding.

BI & ANALYTICS FEATURES
Explorez les expériences liées aux données qui permettent de prendre des décisions plus efficaces et plus rapides au sein de chaque équipe et fonction.
Créez des visualisations interactives et faciles à utiliser qui soutiennent « Ah ! » moments.
Modernisez vos rapports grâce à des données en temps réel que chacun peut utiliser en libre-service.
Créez des applications à faible code ou pro-code qui améliorent les processus opérationnels.
Partagez en toute sécurité des données et des informations en dehors de votre organisation.
Proposez des expériences de données exploitables qui évoluent grâce à un cadre d'IA fiable.