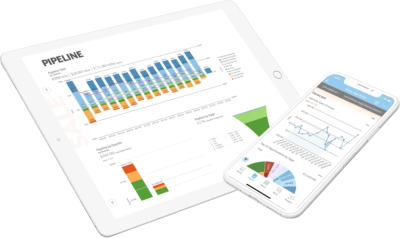
How dashboards help with data analysis
Businesses create dashboards to help them meet their goals and track their KPIs. But they can also use dashboards to actually do the hard work of data analytics. This is accomplished by an analytical dashboard using insights from data gathered over a period chosen by the user.
Utilizing dashboards in data analysis rather than using sophisticated reports enables quick analysis and informational awareness. Users can respond to business questions based on specific business data.
This method of data analysis significantly reduces the learning curve and time to insight, enabling executives and decision makers to take action more quickly. Using this style of data analysis is much faster and much easier than other solutions, making it the best choice for data-driven businesses.
Using a dashboard, businesses can track their known KPIs, and with data analysis, they can combine data streams to create new KPIs. As a result, teams are given all the resources necessary to delve further into their data and uncover the truth.
Dashboards have effectively eliminated the need to sort through numerous reports; in some cases, the data is updated almost instantly. Also, many tools offer quick-start connectors and pre-built dashboard templates, which allow for even quicker data tracking.

The function of dashboards in data analysis
You can obtain vital data analysis and the chance to delve deeper into specific data points to measure success by continuously connecting dashboards to specific metrics. Here are some examples of how businesses use dashboards for data analysis:
In business analysis
The large proportion of dashboards in today’s leading BI solutions are equipped with data analysis tools. These are mainly used in situations where generating real-time insight is essential.
This approach, where users can use in-built data analysis features to edit and reconfigure their dashboards to uncover fresh insights, is called ad hoc analytics. It’s a powerful approach for generating novel analysis.
In many tools, dashboards can be powered up with advanced features like machine learning, data modeling, and forecasting. When used with these tools, dashboards give stakeholders more power and help them make wiser decisions.
In strategizing
Organizations constantly create new strategies and tactics. Dashboards assist them in outlining these strategies so that executives can monitor the status of their objectives or persuade them to take a different path.
By monitoring KPIs, managers and executives can easily come up with fresh ideas and new strategies. By displaying which indicators lead to the most significant change, dashboards also help businesses keep employees focused on the desired outcomes.
In visualizations of interactive data
Businesses can track the health of their business in comparison to benchmarks and goals by visualizing their data. Data dashboards display all the information required to comprehend and track business operations, which empowers users to make better decisions.
Based on how an organization designs its dashboard, even simple numerical data can be made more visually illuminating. This helps users who might otherwise gloss over boring statistics internalize data insight in a more effective way.

In minimizing potential risks
Integrating artificial intelligence-powered data analysis into your analysis dashboard gathers and processes information in a way that gives greater awareness of the situation. For instance, big data analytics could be used to spot potential supply shortages brought on by unforeseen demand or altered consumer behavior.
In planning
Organizations utilize dashboards to display, examine, and compare historical data with current forecasts, budgets, and goals. They can also be used to track and share strategies between departments, which is a great feature for keeping management informed of developments.
In understanding clients
Utilizing big data entails finding patterns and insights as well as developing creative company improvement ideas. The task of developing sound strategies to boost sales revenue or enhance customer retention typically falls to marketing agencies.
In either case, they need to comprehend the users and audience they are working with. Dashboards and data visualization give them this chance by combining data from different sources to make effective client profiles.
What to consider when choosing a dashboard creation tool for data analysis
Create a goal for your dashboard related to the company’s objective to achieve your goals. The dashboard must offer data sets and interactive charts that delve deeply into areas connected to the broad goals to achieve this.
If your objective is to boost sales revenue, you should be monitoring key performance indicators and metrics related to sales. However, the dashboard should monitor KPIs like page views and clicks if you aim to monitor website visits.
With so many dashboard tools available, choosing one is difficult. They all resemble one another and offer comparable features. In either case, there are a few crucial characteristics to keep an eye out for if you want to save time and keep up with shifting KPIs:
Pre-existing templates
Choosing a dashboard tool with pre-existing templates is crucial in building an effective dashboard for data analysis. Pre-made templates simplify dashboard creation, reduce the workload, boost productivity, and conserve time.

Visual hierarchy
When there are too many KPIs to track, changing the size and placement of widgets to show hierarchy will be helpful. This feature is essential if you want to quickly respond to important business queries and present data appealingly. This can enable you to stand out from the crowd and take pleasure in data analysis.
It should be dynamic
A dashboard should be interactive and use data to tell a compelling narrative. Users should be able to filter visualizations, drill down to specific data streams, and adjust the time scales of time-based visualizations.
These features help users access deeper, more advanced insights while also encouraging data curiosity and self-led experimentation. Make sure your dashboard-creation tool includes more than just the essentials.
Should be able to gather data from different sources
One of the most crucial features of a good data dashboard is the ability to synthesize data from various sources. This way, users can unlock insights that would otherwise be invisible.
This ability starts further upstream, at the data integration and data transformation levels. To be able to perform this valuable data synthesis, a BI tool needs to be able to collect and transform data from every source you want to access.
The bottom line
Businesses and marketing firms evaluate the success of their efforts every day. To make sure they are progressing, they need to assess the company’s performance. The proper tools and resources must be put in place when it comes to data analysis to help identify any problems and provide insightful data.
Data visualization tools like dashboards make it possible for all users to comprehend the analytics that are important to their department, business, or project. Dashboards enable even non-technical users to participate in and comprehend the analytics process by gathering data and visualizing trends and occurrences.
Check out some related resources:

Sisense Alternatives & Competitors

10 Power BI Alternatives and Competitors in 2025


