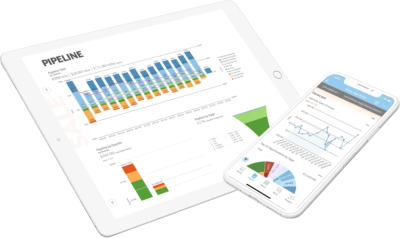
Creating a single source of truth for Excel reports
Imagine this scenario: it’s the end of the month and you’re in charge of generating a report on your company’s sales numbers. You pull up an Excel spreadsheet that contains all of the sales data from each of your team members.
You spend the next hour or so copy-pasting data from each individual Excel file into a new master Excel file. Once you have all of the data in one place, you can start to compile your report.
As you compile, you begin to feel a sinking feeling in your stomach. You realize that one of your team members accidentally entered their data in centimeters instead of inches, which is throwing off all of your calculations.
You spend the next hour or so trying to figure out how to fix the error, and in the end, you’re left with a report that’s full of inaccuracies and errors.
This scenario is all too common in businesses that rely on Excel for reporting. Excel wasn’t built for compiling data from multiple sources—it’s a flat-file format that isn’t meant for complex data manipulation.
When businesses try to use Excel for reporting, they quickly run into problems with errors, inaccuracies, and lack of scalability. The solution is to combine Excel reports into a single source of truth in your BI tool.
But how can you do that?
In this article, we will look at how you can use your BI tool to create a single source of truth for all of your Excel reports. We will also look at some of the benefits of doing this, such as increased accuracy and scalability.
In this article, we will talk about:
- Why you should combine Excel reports into a single source of truth in your BI tool
- How to use your BI tool to create a single source of truth for all of your Excel reports
- The benefits of combining Excel reports into a single source of truth in your BI tool, such as increased accuracy and scalability.
Why use BI with Excel reports?
There are many reasons why you should use your BI tool to create a single source of truth for all of your Excel reports. The most important reason is accuracy.
When you have a single source of truth for your data, you can be confident that the data is accurate. There is no risk of human error, such as accidental data entry mistakes.
Another reason to use your BI tool to combine Excel reports is scalability. Excel is a flat file format, which means it isn’t meant for large data sets. If you try to use Excel to report on data from multiple sources, you will quickly run into problems with scalability.
Your BI tool, on the other hand, is designed for handling large data sets. With your BI tool, you can easily scale your reporting to accommodate more data.
Finally, using your BI tool to combine Excel reports will save you time. Manually compiling data from multiple Excel files is a time-consuming process. With your BI tool, you can automate the process of combining Excel reports, which will save you hours of time each month.

How to use your BI tool to create a single source of truth
Now that we’ve looked at some of the reasons why you should use your BI tool to create a single source of truth for your Excel reports, let’s take a look at how you can do it.
The process involves a few critical steps, and the process may vary depending on the BI tool you’re using. In general, however, the process looks like this:
1. Upload your Excel files into your BI tool.
2. Transform your data to create a single source of truth.
3. Create reports and dashboards from your transformed data.
4. Share your reports and dashboards with stakeholders.
Let’s take a closer look at each of these steps.
1. Upload your Excel files into your BI tool
The process begins with uploading your Excel files into your BI tool. Most BI tools will have an easy-to-use interface for uploading data, so this step should be fairly straightforward.
The BI tool you choose will likely have its own specific instructions for uploading data, so be sure to follow those instructions. In general, however, you should be able to upload your Excel files by clicking on the “Upload Data” button in your BI tool’s interface.
Once you upload your data, it will be stored in the BI tool’s data warehouse. This is important because it means that your data will be centrally located and easy to access.
2. Transform your data to create a single source of truth
The next step is to transform your data to create a single source of truth. This step is critical because it ensures that your data is consistent and accurate.
There are many ways to transform data, but the most common method is to use a process called ETL (extract, transform, load). This process involves extracting data from multiple sources, transforming it into a consistent format, and then loading it into a central location.
ETL can be done manually, but it’s often much easier to use a tool that can automate the process. With ETL, your BI tool will handle the heavy lifting, so you can focus on other tasks.
Once your data is transformed, it will be stored in your BI tool’s data warehouse. This is where all of your reports and dashboards will be created from.
3. Create reports and dashboards from your transformed data
Now that your data is transformed, it’s time for the magic—creating reports and dashboards.
Your BI tool will likely have a variety of built-in templates that you can use to get started. Once you find a template that you like, you can customize it to fit your specific needs.
For example, let’s say you want to create a report that shows sales by region. To do this, you would first find a template that includes sales data. Then, you would customize the template to include the specific information you want to see – in this case, sales by region.
Once you create your report, you can then share it with stakeholders. This is where your BI tool’s sharing capabilities come in handy. With most BI tools, you can easily share reports and dashboards with anyone—even if they don’t have a login to the tool.
4. Share your reports and dashboards with stakeholders
The final step is to share your reports and dashboards with stakeholders. As we mentioned earlier, most BI tools make it easy to share reports and dashboards with anyone—even if they don’t have a login to the tool.
There are a few different ways to share reports and dashboards. The most common method is to send a link via email. This allows stakeholders to view the report or dashboard without having to log in to the BI tool.
Another popular method is to export the report or dashboard as an image or PDF. This is a great option if you want to share the report offline or embed it in another document.
No matter how you choose to share your reports and dashboards, the important thing is that you make them accessible to stakeholders. By doing this, you can ensure that everyone has the information they need to make informed decisions.

Practical tips for building effective Excel reports
Now that you know how to create a single source of truth for Excel reports, let’s take a look at some practical tips that will help you build effective reports.
1. Keep it simple
When it comes to Excel reports, less is more. You don’t need to include every single piece of data in your report. Instead, focus on the information that is most important to your audience.
Why? Because too much information can be overwhelming. And when people are overwhelmed, they’re less likely to make decisions—which is the whole point of a report.
2. Make it easy to understand
Another important tip is to make sure your reports are easy to understand. This means using clear and concise language, and avoiding jargon whenever possible.
It’s also a good idea to use visuals, such as graphs and charts. This will make it easier for people to digest the information in your report.
Why? Because people are more likely to make decisions when they understand the information in front of them.
3. Focus on the future
When you’re creating reports, it’s important to focus on the future. This means thinking about what your audience will need to know in order to make decisions.
For example, let’s say you’re creating a report that shows sales data for the past year. In addition to including data for the past year, you would also want to include projections for the upcoming year. This will give your audience a better idea of what to expect in the future and help them make informed decisions.
4. Use templates to build your Excel reports with BI tools
One of the best ways to build effective Excel reports is to use templates. There are a variety of templates available online, so you’re sure to find one that meets your needs.
Why? Because templates provide a starting point for your report. This means you won’t have to start from scratch, and you can focus on adding the information that is most important to your audience.
Conclusion: don’t let Excel be a roadblock to effective reporting
Excel is a great tool for analyzing data. However, it wasn’t designed for enterprise-wide reporting. If you want to create reports that are easy to understand and share, you need to combine Excel with a BI tool.
Doing this will allow you to create a single source of truth for your reports and make it easy to share them with stakeholders. It will also help you focus on the information that is most important to your audience.
By following the tips in this article, you can ensure that your reports are effective and informative—and give your team the chance to make better decisions.
Check out some related resources:

Domo Named a Strong Performer in The Forrester Wave™️: Business Intelligence Platforms, Q2 2025

The 11 Best Big Data Analytics Tools in 2025


