What Is a Sales Scorecard App? How to Track and Improve Sales
A sales scorecard app is a powerful tool designed to measure and improve the performance of individual sales representatives or entire teams. By tracking progress toward specific goals using real-time metrics, it enables immediate feedback, data-driven decision-making, and actionable insights. Sales scorecards are invaluable for identifying trends, optimizing strategies, and ensuring each team member’s contribution aligns with broader business objectives.
What Is a Sales Scorecard?
A sales scorecard provides a clear snapshot of sales performance, capturing both activity-based metrics like calls made and demos scheduled, as well as outcome-driven KPIs such as close rates and revenue. These scorecards can be tailored to individual reps or teams and are most effective when powered by live, dynamic data.
Key Components of a Sales Scorecard:
- Sales Goals: What targets are you aiming to meet?
- Key Performance Indicators (KPIs): How will you measure progress?
- Target Values vs. Actuals: What was expected versus what was achieved?
- Trends and Patterns: What direction is performance heading?

Why Use a Sales Scorecard?
A well-implemented sales scorecard offers numerous benefits that help drive better results and improve team performance:
- Focus on Goals: Keeps teams aligned with clear objectives.
- Identify Areas for Improvement: Pinpoints weak spots that need attention.
- Proactive Strategy Adjustments: Allows real-time course correction to optimize results.
- Track Performance Over Time: Provides visibility into long-term trends.
- Promote Accountability and Motivation: Encourages employees to take ownership of their work and strive for improvement.
By combining real-time data with intuitive visual storytelling, sales scorecards empower teams with the insights they need to achieve stronger outcomes and exceed goals.
How to Build a Sales Scorecard App Using a BI Tool
To create an effective sales scorecard app, you’ll need a robust business intelligence (BI) platform capable of real-time tracking, customization, and seamless data integration. Follow these steps to build a sales scorecard that delivers value and enhances performance:
Step 1: Define Your KPIs
Start by selecting KPIs that directly align with your sales goals. The most impactful KPIs depend on your team’s objectives but commonly include:
- Number of Calls Made: Tracks your outreach activity.
- Number of Demos Scheduled: Measures lead engagement.
- Opportunities Created: Evaluates lead nurturing success.
- Deals Won: Tracks closed business.
- Close Rate: Assesses sales effectiveness.
- Average Sales Price (ASP): Monitors revenue per sale.
- Conversion Rates by Stage: Measures progress through the sales funnel.
- Time in Sales Cycle Stages: Highlights bottlenecks in the process.
- The right KPIs should be specific, measurable, and directly tied to your team’s success.
Step 2: Collect and Integrate Your Data
Gather data from your existing tools, such as CRM platforms, marketing automation software, and sales analytics tools. Use data connectors to integrate this information into your BI platform. A good BI tool will centralize your data, update it in real-time, and ensure that your scorecard reflects the most accurate and actionable insights.
Step 3: Create Your Scorecard
Design your scorecard by mapping each KPI to a specific visualization type. Choose charts or graphs that make data easy to understand and interpret at a glance. For example:
- Bar Charts: Ideal for tracking sales activity volume, such as calls made or demos scheduled.
- Line Charts: Best for monitoring trends in conversion rates, revenue growth, or close rates over time.
- Funnel Visualizations: Clearly illustrate progression through the sales pipeline.
- Pie Charts: Useful for showing distribution, such as sales by region or product category.
Step 4: Personalize and Optimize
Customize your sales scorecard to meet the unique needs of your team or individual reps. Add filters to drill down into specific data points, such as performance by region, role, or time period. Keep the design clean and intuitive, ensuring that the scorecard provides value without overwhelming users with unnecessary complexity.
Step 5: Share Insights and Take Action
Once your scorecard is ready, share it with your team and incorporate it into regular performance reviews. Use insights from the scorecard to celebrate wins, address challenges, and refine strategies. With real-time updates and clear visualizations, teams can easily stay on track and make adjustments as needed.
Conclusion
A sales scorecard app is more than just a tracking tool—it’s a strategic asset that helps you measure, analyze, and enhance sales performance. From selecting the right KPIs to leveraging a BI platform for real-time insights, creating a sales scorecard is an essential step toward smarter, more efficient sales management. By using this tool to align individual efforts with broader goals, your team can achieve meaningful growth and long-term success.
Ready to see how Domo can help you build smarter, more effective sales scorecards? Explore the Domo platform and discover how real-time data and intuitive dashboards can drive sales performance at every level.
Check out some related resources:

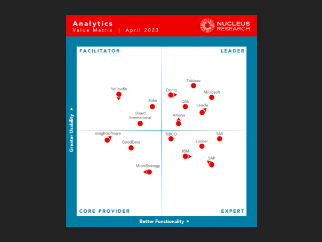
Domo Named a Leader in Nucleus Research’s 2023 Analytics Technology Value Matrix

Unlocking the Future of Software with Analytics


